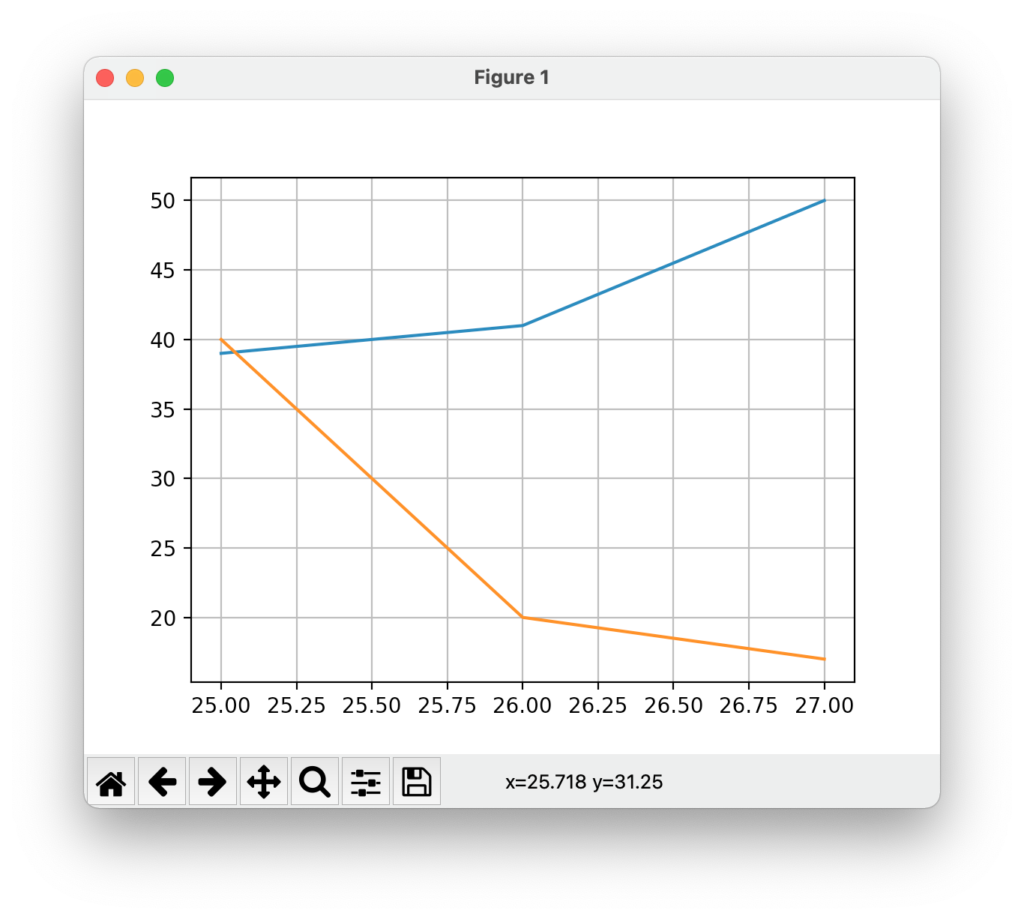
pyplot grid で縦横線(罫線のようなもの)を引くことができる。
例
from matplotlib import pyplot as plt

data_x = [25,26,27]
data_y = [39,41,50]
data_y2 = [40,20,17]

plt.plot(data_x,data_y)
plt.plot(data_x,data_y2)

plt.grid(True)

plt.show()
結果
雑記
投稿日:2021年6月11日 更新日:
pyplot grid で縦横線(罫線のようなもの)を引くことができる。
from matplotlib import pyplot as plt
data_x = [25,26,27]
data_y = [39,41,50]
data_y2 = [40,20,17]
plt.plot(data_x,data_y)
plt.plot(data_x,data_y2)
plt.grid(True)
plt.show()執筆者:seyanen
関連記事

python3 でクラス内からだけアクセスするメソッドを作る方法
1.メソッド内でメソッドを定義する2.メソッド最初にアンダースコアをつける(慣習)例: def _some_internal_func(self): … このうち、2.のメソッド名先頭にアンダース …
matplotlib でグラフの背景の色を変える方法(facecolor)
次のように、axes で facecolor を変更すればよい。 例 from matplotlib import pyplot as plt x = [2,7,8] y = [7,1 …
matplotlib でグラフ表示ウィンドウの画面上の位置を自由に設定する方法
matplotlib.use(‘TkAgg’) としておき、 get_current_fig_manager().window.wm_geometry(“+20+50”) として、(+20+50)のと …
readline を使って次のように書く。 例 ファイル:data.txt # id name age 1 佐藤太郎 10 2 鈴木花子 18 3 坂本明美 21 4 松村光子 24 5 小川奏子 1 …
matplotlib で、粗い刻みと細かい刻みの目盛りを表示する方法
set_major_locator で粗い刻みの目盛りを調整する。 set_minor_locator で、細かい刻みの目盛りを調整する。 以下の例で set_major_formatter は、表示 …
スポンサーリンク
2024/01/09

2023/01/18
matplotlib のグラフ作成と gnuplot との対応 比較
2022/10/14
pythonで配列(リスト)の、ある要素がわかっているときにその次の要素を取得する方法。
2022/10/09
2022/09/05
![[商品価格に関しましては、リンクが作成された時点と現時点で情報が変更されている場合がございます。]](https://hbb.afl.rakuten.co.jp/hgb/2ae66f5e.1c6eabdc.2ae66f5f.baa0ec1d/?me_id=1339082&item_id=10089082&pc=https%3A%2F%2Fthumbnail.image.rakuten.co.jp%2F%400_mall%2Fitunes%2Fcabinet%2Fmem_item%2Fimgrc0090874582.jpg%3F_ex%3D240x240&s=240x240&t=picttext "[商品価格に関しましては、リンクが作成された時点と現時点で情報が変更されている場合がございます。]")

![[商品価格に関しましては、リンクが作成された時点と現時点で情報が変更されている場合がございます。]](https://hbb.afl.rakuten.co.jp/hgb/38943163.9ed7feb6.38943164.feb189f1/?me_id=1370968&item_id=10199606&pc=https%3A%2F%2Fthumbnail.image.rakuten.co.jp%2F%400_mall%2Fgpgiftcard%2Fcabinet%2Fnewcrad.jpg%3F_ex%3D240x240&s=240x240&t=picttext "[商品価格に関しましては、リンクが作成された時点と現時点で情報が変更されている場合がございます。]")
![[商品価格に関しましては、リンクが作成された時点と現時点で情報が変更されている場合がございます。]](https://hbb.afl.rakuten.co.jp/hgb/1e4f62be.725c8a0a.1e4f62bf.82312a17/?me_id=1269553&item_id=13798775&pc=https%3A%2F%2Fthumbnail.image.rakuten.co.jp%2F%400_mall%2Fbiccamera%2Fcabinet%2Fproduct%2F7134%2F00000010267425_a01.jpg%3F_ex%3D100x100&s=100x100&t=picttext "[商品価格に関しましては、リンクが作成された時点と現時点で情報が変更されている場合がございます。]")
![[商品価格に関しましては、リンクが作成された時点と現時点で情報が変更されている場合がございます。]](https://hbb.afl.rakuten.co.jp/hgb/1e4f62be.725c8a0a.1e4f62bf.82312a17/?me_id=1269553&item_id=12697495&pc=https%3A%2F%2Fthumbnail.image.rakuten.co.jp%2F%400_mall%2Fbiccamera%2Fcabinet%2Fproduct%2F4694%2F00000007127888_a01.jpg%3F_ex%3D100x100&s=100x100&t=picttext "[商品価格に関しましては、リンクが作成された時点と現時点で情報が変更されている場合がございます。]")
![[商品価格に関しましては、リンクが作成された時点と現時点で情報が変更されている場合がございます。]](https://hbb.afl.rakuten.co.jp/hgb/2124eef8.f98c36bb.2124eef9.b64e560c/?me_id=1357621&item_id=10581058&pc=https%3A%2F%2Fthumbnail.image.rakuten.co.jp%2F%400_mall%2Fyamada-denki%2Fcabinet%2Fa07000292%2F6892433018.jpg%3F_ex%3D100x100&s=100x100&t=picttext "[商品価格に関しましては、リンクが作成された時点と現時点で情報が変更されている場合がございます。]")
![[商品価格に関しましては、リンクが作成された時点と現時点で情報が変更されている場合がございます。]](https://hbb.afl.rakuten.co.jp/hgb/38943afe.b4232a1b.38943aff.3dfb7d7d/?me_id=1278318&item_id=10000451&pc=https%3A%2F%2Fthumbnail.image.rakuten.co.jp%2F%400_mall%2Firobotstore%2Fcabinet%2Fitem_thum%2Fbr_thum%2Fj9p_tm.jpg%3F_ex%3D100x100&s=100x100&t=picttext "[商品価格に関しましては、リンクが作成された時点と現時点で情報が変更されている場合がございます。]")