pyplot grid で縦横線(罫線のようなもの)を引くことができる。
例
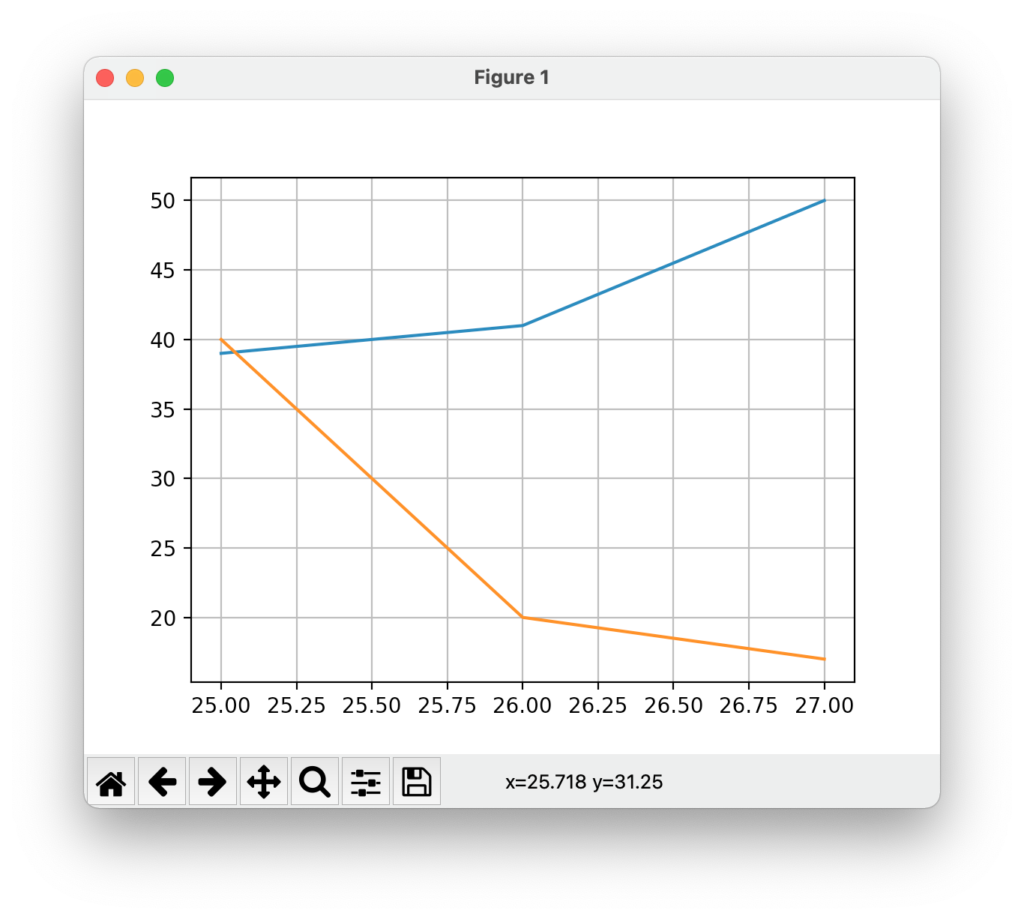
from matplotlib import pyplot as plt

data_x = [25,26,27]
data_y = [39,41,50]
data_y2 = [40,20,17]

plt.plot(data_x,data_y)
plt.plot(data_x,data_y2)

plt.grid(True)

plt.show()
結果
雑記
投稿日:2021年6月11日 更新日:
pyplot grid で縦横線(罫線のようなもの)を引くことができる。
from matplotlib import pyplot as plt
data_x = [25,26,27]
data_y = [39,41,50]
data_y2 = [40,20,17]
plt.plot(data_x,data_y)
plt.plot(data_x,data_y2)
plt.grid(True)
plt.show()執筆者:seyanen
関連記事

python3 で、配列の最大値のインデックスを1つ求める方法
配列の index() メソッドを使うと、その値のインデックスを求めることができる。 最大値を求めるメソッド max と組み合わせて使う。 例 arr = [2,4,5,10,8,-3] in …
凡例(legend)の表示位置を変更するには、axis の legend の loc を設定する。 次のリンクhttps://matplotlib.org/stable/api/_as_gen/mat …
「linestyle = 」として、線の種類を指定することができる設定の詳細は、次のリンクを参照。 https://matplotlib.org/stable/gallery/lines_bars_a …
pyplt.scatter を使って散布グラフを描くことができる。 点の色は、点ごとに変えることができる。 下の例では color の配列で点の色を指定している。 例 from matplotlib …
ラムダ式を使って、任意の要素についてソートすることができる。 例 arr = [[1,2,3],[2,1,2],[3,3,4],[4,4,1]] for i i …
スポンサーリンク
2024/01/09

2023/01/18
matplotlib のグラフ作成と gnuplot との対応 比較
2022/10/14
pythonで配列(リスト)の、ある要素がわかっているときにその次の要素を取得する方法。
2022/10/09
2022/09/05
![[商品価格に関しましては、リンクが作成された時点と現時点で情報が変更されている場合がございます。]](https://hbb.afl.rakuten.co.jp/hgb/2ae66f5e.1c6eabdc.2ae66f5f.baa0ec1d/?me_id=1339082&item_id=10089082&pc=https%3A%2F%2Fthumbnail.image.rakuten.co.jp%2F%400_mall%2Fitunes%2Fcabinet%2Fmem_item%2Fimgrc0090874582.jpg%3F_ex%3D240x240&s=240x240&t=picttext "[商品価格に関しましては、リンクが作成された時点と現時点で情報が変更されている場合がございます。]")

![[商品価格に関しましては、リンクが作成された時点と現時点で情報が変更されている場合がございます。]](https://hbb.afl.rakuten.co.jp/hgb/38943163.9ed7feb6.38943164.feb189f1/?me_id=1370968&item_id=10199606&pc=https%3A%2F%2Fthumbnail.image.rakuten.co.jp%2F%400_mall%2Fgpgiftcard%2Fcabinet%2Fnewcrad.jpg%3F_ex%3D240x240&s=240x240&t=picttext "[商品価格に関しましては、リンクが作成された時点と現時点で情報が変更されている場合がございます。]")
![[商品価格に関しましては、リンクが作成された時点と現時点で情報が変更されている場合がございます。]](https://hbb.afl.rakuten.co.jp/hgb/1e4f62be.725c8a0a.1e4f62bf.82312a17/?me_id=1269553&item_id=13798775&pc=https%3A%2F%2Fthumbnail.image.rakuten.co.jp%2F%400_mall%2Fbiccamera%2Fcabinet%2Fproduct%2F7134%2F00000010267425_a01.jpg%3F_ex%3D100x100&s=100x100&t=picttext "[商品価格に関しましては、リンクが作成された時点と現時点で情報が変更されている場合がございます。]")
![[商品価格に関しましては、リンクが作成された時点と現時点で情報が変更されている場合がございます。]](https://hbb.afl.rakuten.co.jp/hgb/1e4f62be.725c8a0a.1e4f62bf.82312a17/?me_id=1269553&item_id=12697495&pc=https%3A%2F%2Fthumbnail.image.rakuten.co.jp%2F%400_mall%2Fbiccamera%2Fcabinet%2Fproduct%2F4694%2F00000007127888_a01.jpg%3F_ex%3D100x100&s=100x100&t=picttext "[商品価格に関しましては、リンクが作成された時点と現時点で情報が変更されている場合がございます。]")
![[商品価格に関しましては、リンクが作成された時点と現時点で情報が変更されている場合がございます。]](https://hbb.afl.rakuten.co.jp/hgb/2124eef8.f98c36bb.2124eef9.b64e560c/?me_id=1357621&item_id=10581058&pc=https%3A%2F%2Fthumbnail.image.rakuten.co.jp%2F%400_mall%2Fyamada-denki%2Fcabinet%2Fa07000292%2F6892433018.jpg%3F_ex%3D100x100&s=100x100&t=picttext "[商品価格に関しましては、リンクが作成された時点と現時点で情報が変更されている場合がございます。]")
![[商品価格に関しましては、リンクが作成された時点と現時点で情報が変更されている場合がございます。]](https://hbb.afl.rakuten.co.jp/hgb/38943afe.b4232a1b.38943aff.3dfb7d7d/?me_id=1278318&item_id=10000451&pc=https%3A%2F%2Fthumbnail.image.rakuten.co.jp%2F%400_mall%2Firobotstore%2Fcabinet%2Fitem_thum%2Fbr_thum%2Fj9p_tm.jpg%3F_ex%3D100x100&s=100x100&t=picttext "[商品価格に関しましては、リンクが作成された時点と現時点で情報が変更されている場合がございます。]")