screenshot-2023-01-17-17.01.52
投稿日:
執筆者:seyanen
雑記
投稿日:
執筆者:seyanen
関連記事

pythonで配列(リスト)の、ある要素がわかっているときにその次の要素を取得する方法。
リストを iter に変えたあと、… next() を使う。 参考リンク https://www.programiz.com/python-programming/methods/buil …
ベータ(β)は、ギリシャ文字の2番目の文字。数学等でよく使われる。 例 $\beta$ 結果
文字列を含むかどうか判定するには、string の find を使う。見つからなかった場合は、std::string::npos を返す。 例 #include <iostream> #i …

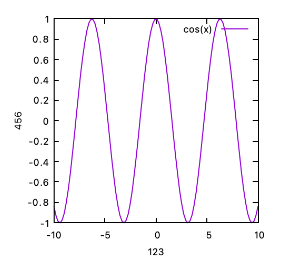
matplotlib のグラフ作成と gnuplot との対応 比較
起動方法 gnuplot コマンドで $ gnuplot とすれば起動できる。 初期設定ファイルは gnuplotrc にある。 gnuplotrc の場所の見つけ方(macの場合) https:// …
マッキンリー山(McKinley)は、北アメリカ大陸で最も高い山です。 米国アラスカ州にあります。 改名 マッキンリーは2015年、デナリ(Denali)に改称されました。 デナリとは、アラスカの先住 …
スポンサーリンク
2024/01/09
2023/01/18
matplotlib のグラフ作成と gnuplot との対応 比較
2022/10/14
pythonで配列(リスト)の、ある要素がわかっているときにその次の要素を取得する方法。
2022/10/09
2022/09/05
![[商品価格に関しましては、リンクが作成された時点と現時点で情報が変更されている場合がございます。]](https://hbb.afl.rakuten.co.jp/hgb/2ae66f5e.1c6eabdc.2ae66f5f.baa0ec1d/?me_id=1339082&item_id=10089082&pc=https%3A%2F%2Fthumbnail.image.rakuten.co.jp%2F%400_mall%2Fitunes%2Fcabinet%2Fmem_item%2Fimgrc0090874582.jpg%3F_ex%3D240x240&s=240x240&t=picttext "[商品価格に関しましては、リンクが作成された時点と現時点で情報が変更されている場合がございます。]")

![[商品価格に関しましては、リンクが作成された時点と現時点で情報が変更されている場合がございます。]](https://hbb.afl.rakuten.co.jp/hgb/38943163.9ed7feb6.38943164.feb189f1/?me_id=1370968&item_id=10199606&pc=https%3A%2F%2Fthumbnail.image.rakuten.co.jp%2F%400_mall%2Fgpgiftcard%2Fcabinet%2Fnewcrad.jpg%3F_ex%3D240x240&s=240x240&t=picttext "[商品価格に関しましては、リンクが作成された時点と現時点で情報が変更されている場合がございます。]")
![[商品価格に関しましては、リンクが作成された時点と現時点で情報が変更されている場合がございます。]](https://hbb.afl.rakuten.co.jp/hgb/1e4f62be.725c8a0a.1e4f62bf.82312a17/?me_id=1269553&item_id=13798775&pc=https%3A%2F%2Fthumbnail.image.rakuten.co.jp%2F%400_mall%2Fbiccamera%2Fcabinet%2Fproduct%2F7134%2F00000010267425_a01.jpg%3F_ex%3D100x100&s=100x100&t=picttext "[商品価格に関しましては、リンクが作成された時点と現時点で情報が変更されている場合がございます。]")
![[商品価格に関しましては、リンクが作成された時点と現時点で情報が変更されている場合がございます。]](https://hbb.afl.rakuten.co.jp/hgb/1e4f62be.725c8a0a.1e4f62bf.82312a17/?me_id=1269553&item_id=12697495&pc=https%3A%2F%2Fthumbnail.image.rakuten.co.jp%2F%400_mall%2Fbiccamera%2Fcabinet%2Fproduct%2F4694%2F00000007127888_a01.jpg%3F_ex%3D100x100&s=100x100&t=picttext "[商品価格に関しましては、リンクが作成された時点と現時点で情報が変更されている場合がございます。]")
![[商品価格に関しましては、リンクが作成された時点と現時点で情報が変更されている場合がございます。]](https://hbb.afl.rakuten.co.jp/hgb/2124eef8.f98c36bb.2124eef9.b64e560c/?me_id=1357621&item_id=10581058&pc=https%3A%2F%2Fthumbnail.image.rakuten.co.jp%2F%400_mall%2Fyamada-denki%2Fcabinet%2Fa07000292%2F6892433018.jpg%3F_ex%3D100x100&s=100x100&t=picttext "[商品価格に関しましては、リンクが作成された時点と現時点で情報が変更されている場合がございます。]")
![[商品価格に関しましては、リンクが作成された時点と現時点で情報が変更されている場合がございます。]](https://hbb.afl.rakuten.co.jp/hgb/38943afe.b4232a1b.38943aff.3dfb7d7d/?me_id=1278318&item_id=10000451&pc=https%3A%2F%2Fthumbnail.image.rakuten.co.jp%2F%400_mall%2Firobotstore%2Fcabinet%2Fitem_thum%2Fbr_thum%2Fj9p_tm.jpg%3F_ex%3D100x100&s=100x100&t=picttext "[商品価格に関しましては、リンクが作成された時点と現時点で情報が変更されている場合がございます。]")