screenshot-2021-06-10-at-19.39.15
投稿日:
執筆者:seyanen
雑記
投稿日:
執筆者:seyanen
関連記事

アスタリスクは、「*」記号で入力できる。tex の数式モードと、数式モードの外で書き方が異なるので注意。 例 数式モードの中:math mode $x^{*} A* B^{**}$数式モードの外:te …
result.txt というファイルに “data1 data2 data3” という内容を保存する。ofstream を使って書き出す。 例 #include<iost …
% のときに、マイナスを前に付けると、 出力結果を左詰めにすることができる。 例 #include <stdio.h> int main () { int i; for(i=1;i<100 …
ダガー記号には、$\dagger$ を使う。上付きにしたい場合には、$^$ と組み合わせる。 例 $A^{\dagger}$ 結果
\| を使う。 例 $\|u\|$ 結果 美味しんぼ(43)【電子書籍】[ 雁屋哲 ]価格:605円(税別、送料別)(2020/12/25時点)楽天で購入
スポンサーリンク
2024/01/09

2023/01/18
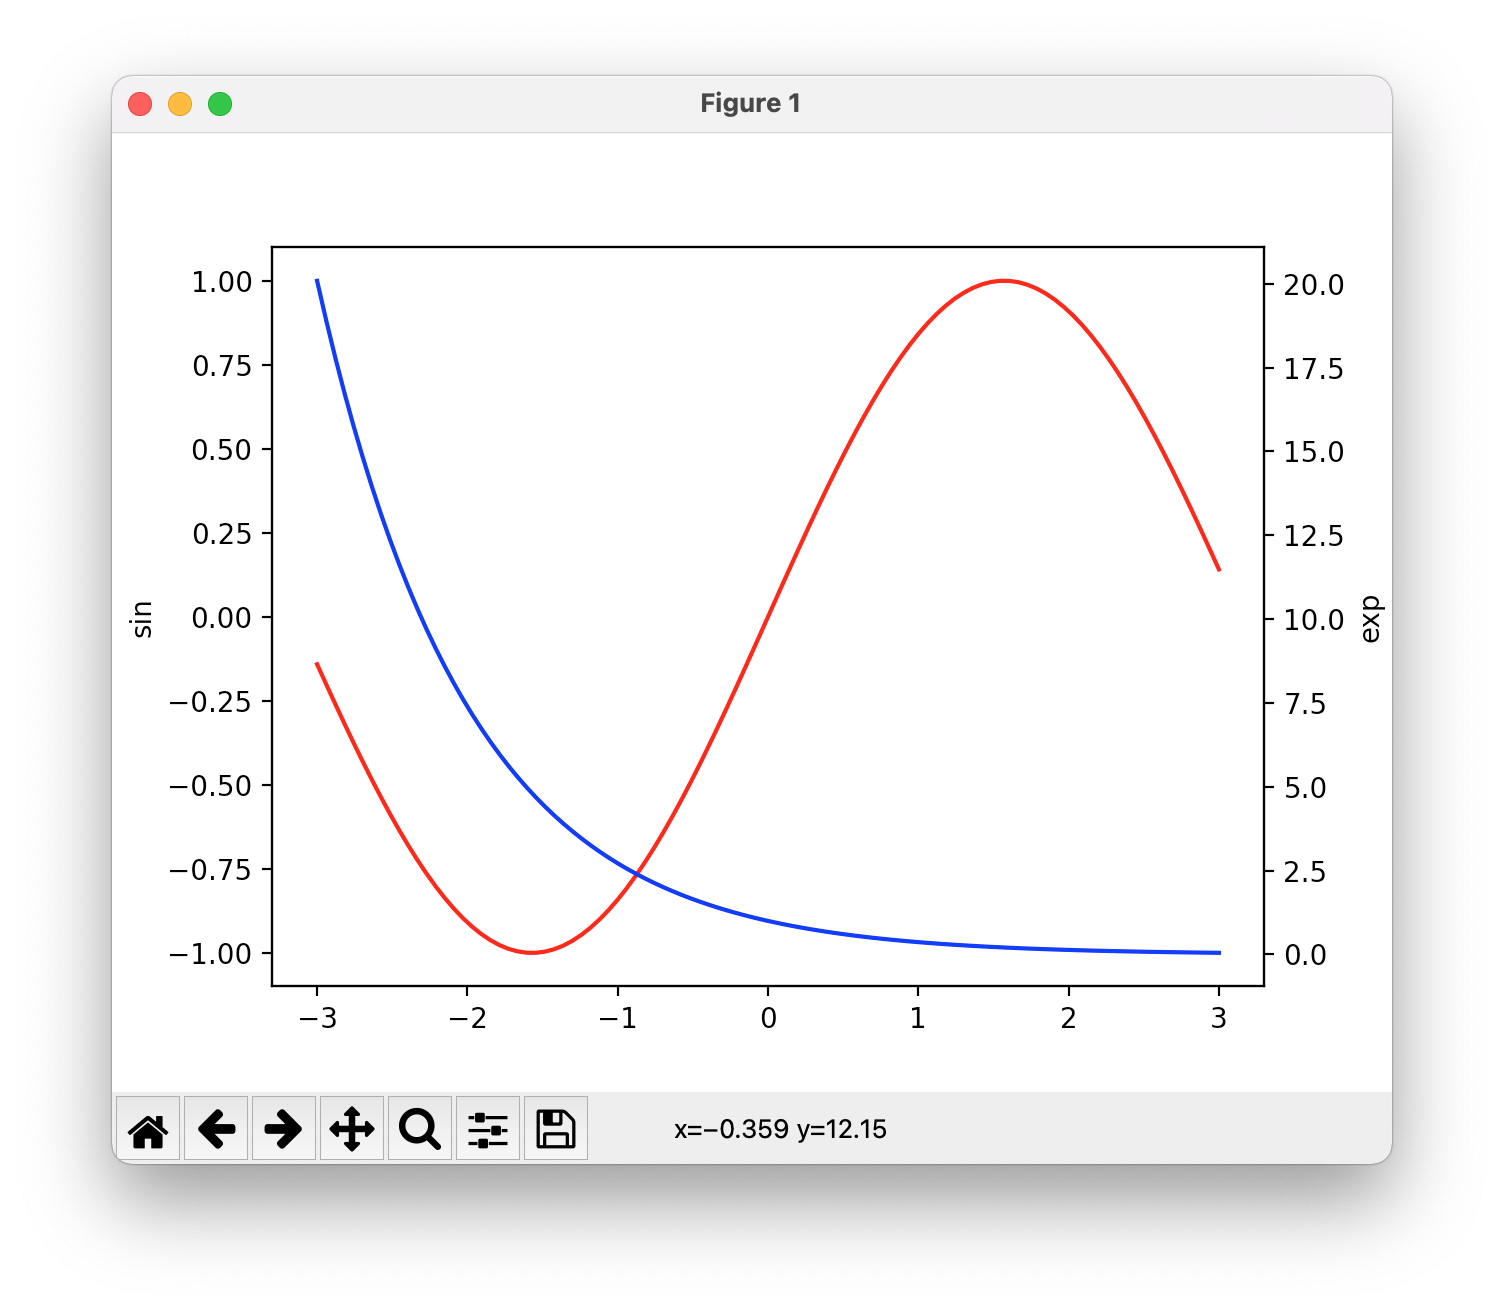
matplotlib のグラフ作成と gnuplot との対応 比較
2022/10/14
pythonで配列(リスト)の、ある要素がわかっているときにその次の要素を取得する方法。
2022/10/09
2022/09/05
![[商品価格に関しましては、リンクが作成された時点と現時点で情報が変更されている場合がございます。]](https://hbb.afl.rakuten.co.jp/hgb/2ae66f5e.1c6eabdc.2ae66f5f.baa0ec1d/?me_id=1339082&item_id=10089082&pc=https%3A%2F%2Fthumbnail.image.rakuten.co.jp%2F%400_mall%2Fitunes%2Fcabinet%2Fmem_item%2Fimgrc0090874582.jpg%3F_ex%3D240x240&s=240x240&t=picttext "[商品価格に関しましては、リンクが作成された時点と現時点で情報が変更されている場合がございます。]")

![[商品価格に関しましては、リンクが作成された時点と現時点で情報が変更されている場合がございます。]](https://hbb.afl.rakuten.co.jp/hgb/38943163.9ed7feb6.38943164.feb189f1/?me_id=1370968&item_id=10199606&pc=https%3A%2F%2Fthumbnail.image.rakuten.co.jp%2F%400_mall%2Fgpgiftcard%2Fcabinet%2Fnewcrad.jpg%3F_ex%3D240x240&s=240x240&t=picttext "[商品価格に関しましては、リンクが作成された時点と現時点で情報が変更されている場合がございます。]")
![[商品価格に関しましては、リンクが作成された時点と現時点で情報が変更されている場合がございます。]](https://hbb.afl.rakuten.co.jp/hgb/1e4f62be.725c8a0a.1e4f62bf.82312a17/?me_id=1269553&item_id=13798775&pc=https%3A%2F%2Fthumbnail.image.rakuten.co.jp%2F%400_mall%2Fbiccamera%2Fcabinet%2Fproduct%2F7134%2F00000010267425_a01.jpg%3F_ex%3D100x100&s=100x100&t=picttext "[商品価格に関しましては、リンクが作成された時点と現時点で情報が変更されている場合がございます。]")
![[商品価格に関しましては、リンクが作成された時点と現時点で情報が変更されている場合がございます。]](https://hbb.afl.rakuten.co.jp/hgb/1e4f62be.725c8a0a.1e4f62bf.82312a17/?me_id=1269553&item_id=12697495&pc=https%3A%2F%2Fthumbnail.image.rakuten.co.jp%2F%400_mall%2Fbiccamera%2Fcabinet%2Fproduct%2F4694%2F00000007127888_a01.jpg%3F_ex%3D100x100&s=100x100&t=picttext "[商品価格に関しましては、リンクが作成された時点と現時点で情報が変更されている場合がございます。]")
![[商品価格に関しましては、リンクが作成された時点と現時点で情報が変更されている場合がございます。]](https://hbb.afl.rakuten.co.jp/hgb/2124eef8.f98c36bb.2124eef9.b64e560c/?me_id=1357621&item_id=10581058&pc=https%3A%2F%2Fthumbnail.image.rakuten.co.jp%2F%400_mall%2Fyamada-denki%2Fcabinet%2Fa07000292%2F6892433018.jpg%3F_ex%3D100x100&s=100x100&t=picttext "[商品価格に関しましては、リンクが作成された時点と現時点で情報が変更されている場合がございます。]")
![[商品価格に関しましては、リンクが作成された時点と現時点で情報が変更されている場合がございます。]](https://hbb.afl.rakuten.co.jp/hgb/38943afe.b4232a1b.38943aff.3dfb7d7d/?me_id=1278318&item_id=10000451&pc=https%3A%2F%2Fthumbnail.image.rakuten.co.jp%2F%400_mall%2Firobotstore%2Fcabinet%2Fitem_thum%2Fbr_thum%2Fj9p_tm.jpg%3F_ex%3D100x100&s=100x100&t=picttext "[商品価格に関しましては、リンクが作成された時点と現時点で情報が変更されている場合がございます。]")