screenshot-2021-06-09-at-22.37.09
投稿日:
執筆者:seyanen
雑記
投稿日:
執筆者:seyanen
関連記事

\mathbf を使う。 例 $\mathbf{E}(\xi)$ 結果
集合の「内部」を表す記号を入力するには、\mathring{} を使う。 例 $\mathring{S}$ 結果
gnup debugger の略。 linux で広く使われているデバッガ。 デバッガとは、プログラムのバグの原因を探るために使うプログラムのこと。 プログラムのバグを探すには、デバッガを使う方法より …
amsmath パッケージを使っておき、\begin{equation} と \end{equation} の数式中で \tag を使うと式番号を自分で指定したとおりに表示できる。(式番号の中に日本語 …
python3 で辞書(dict) の for ループでキーと値を取得する
キーと値を取得するには次のようにする。キーは dict のループ、値は dict の values() のループで取得できる。 例 mydictionary = {‘color’: ‘白’, ‘ani …
スポンサーリンク
2024/01/09

2023/01/18
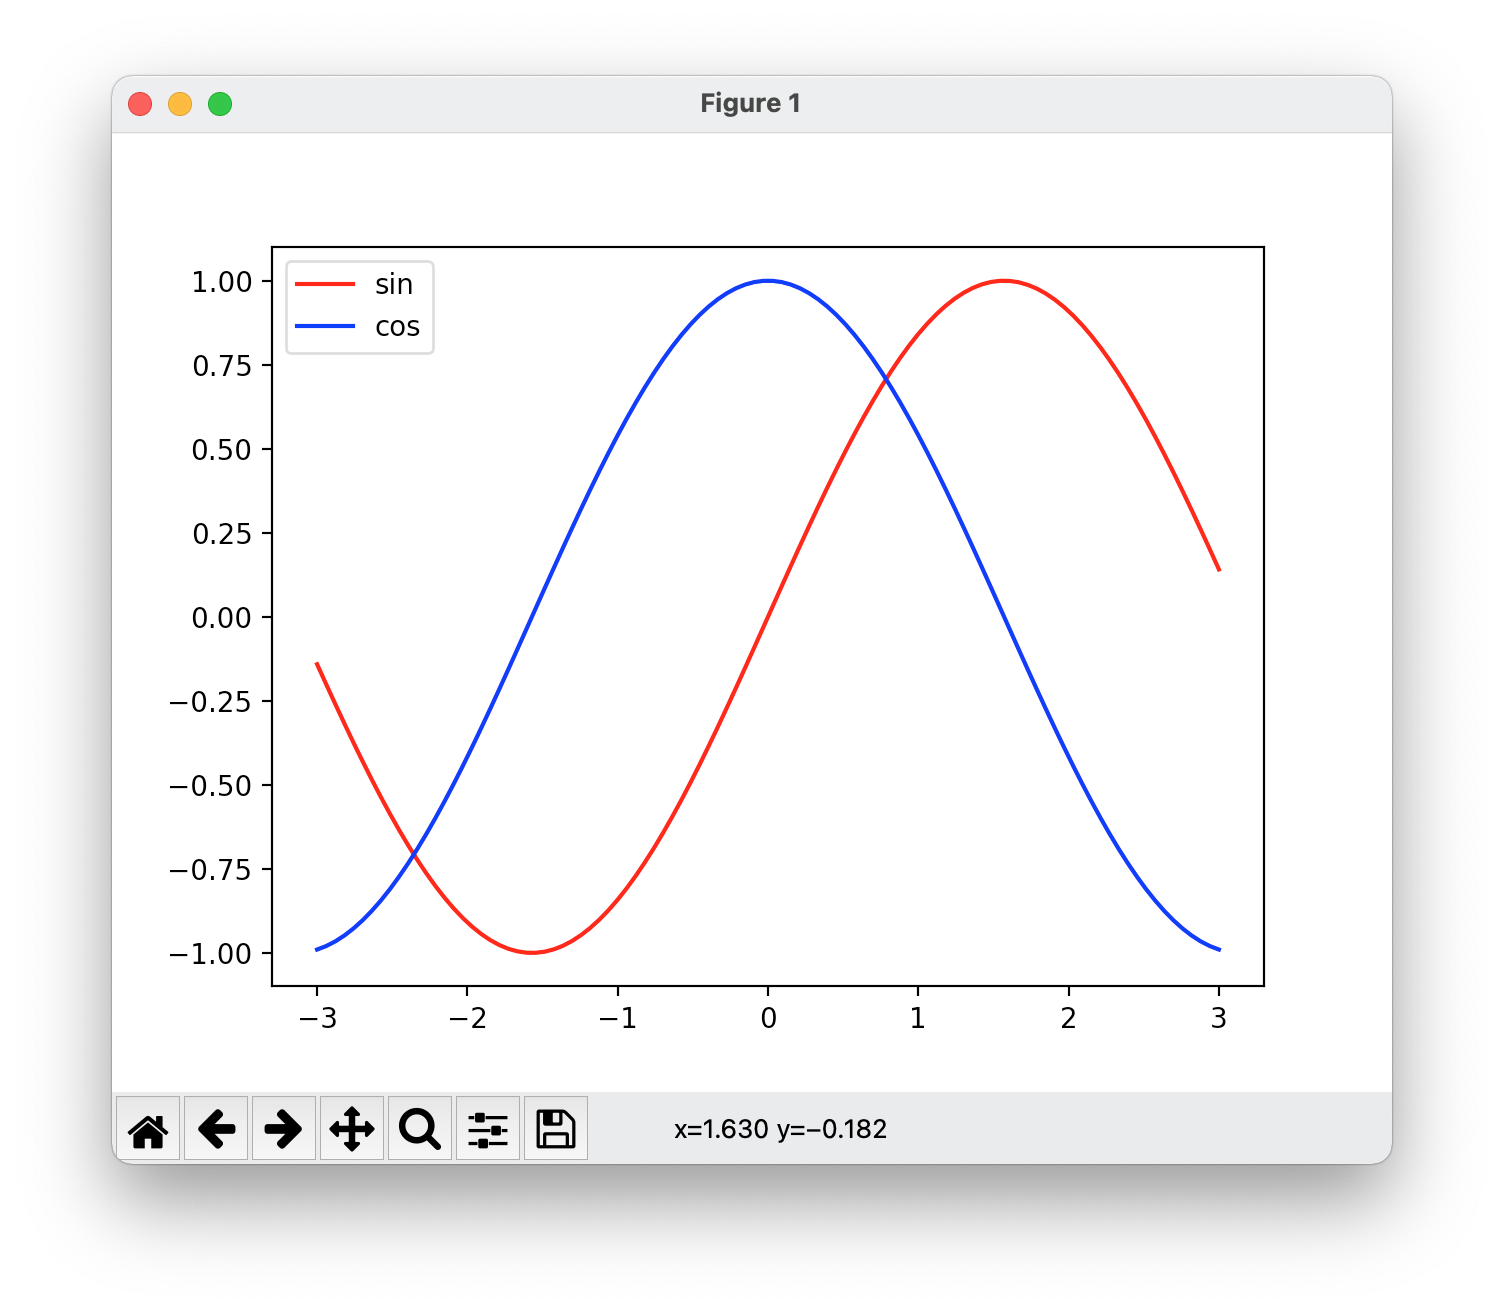
matplotlib のグラフ作成と gnuplot との対応 比較
2022/10/14
pythonで配列(リスト)の、ある要素がわかっているときにその次の要素を取得する方法。
2022/10/09
2022/09/05
![[商品価格に関しましては、リンクが作成された時点と現時点で情報が変更されている場合がございます。]](https://hbb.afl.rakuten.co.jp/hgb/2ae66f5e.1c6eabdc.2ae66f5f.baa0ec1d/?me_id=1339082&item_id=10089082&pc=https%3A%2F%2Fthumbnail.image.rakuten.co.jp%2F%400_mall%2Fitunes%2Fcabinet%2Fmem_item%2Fimgrc0090874582.jpg%3F_ex%3D240x240&s=240x240&t=picttext "[商品価格に関しましては、リンクが作成された時点と現時点で情報が変更されている場合がございます。]")

![[商品価格に関しましては、リンクが作成された時点と現時点で情報が変更されている場合がございます。]](https://hbb.afl.rakuten.co.jp/hgb/38943163.9ed7feb6.38943164.feb189f1/?me_id=1370968&item_id=10199606&pc=https%3A%2F%2Fthumbnail.image.rakuten.co.jp%2F%400_mall%2Fgpgiftcard%2Fcabinet%2Fnewcrad.jpg%3F_ex%3D240x240&s=240x240&t=picttext "[商品価格に関しましては、リンクが作成された時点と現時点で情報が変更されている場合がございます。]")
![[商品価格に関しましては、リンクが作成された時点と現時点で情報が変更されている場合がございます。]](https://hbb.afl.rakuten.co.jp/hgb/1e4f62be.725c8a0a.1e4f62bf.82312a17/?me_id=1269553&item_id=13798775&pc=https%3A%2F%2Fthumbnail.image.rakuten.co.jp%2F%400_mall%2Fbiccamera%2Fcabinet%2Fproduct%2F7134%2F00000010267425_a01.jpg%3F_ex%3D100x100&s=100x100&t=picttext "[商品価格に関しましては、リンクが作成された時点と現時点で情報が変更されている場合がございます。]")
![[商品価格に関しましては、リンクが作成された時点と現時点で情報が変更されている場合がございます。]](https://hbb.afl.rakuten.co.jp/hgb/1e4f62be.725c8a0a.1e4f62bf.82312a17/?me_id=1269553&item_id=12697495&pc=https%3A%2F%2Fthumbnail.image.rakuten.co.jp%2F%400_mall%2Fbiccamera%2Fcabinet%2Fproduct%2F4694%2F00000007127888_a01.jpg%3F_ex%3D100x100&s=100x100&t=picttext "[商品価格に関しましては、リンクが作成された時点と現時点で情報が変更されている場合がございます。]")
![[商品価格に関しましては、リンクが作成された時点と現時点で情報が変更されている場合がございます。]](https://hbb.afl.rakuten.co.jp/hgb/2124eef8.f98c36bb.2124eef9.b64e560c/?me_id=1357621&item_id=10581058&pc=https%3A%2F%2Fthumbnail.image.rakuten.co.jp%2F%400_mall%2Fyamada-denki%2Fcabinet%2Fa07000292%2F6892433018.jpg%3F_ex%3D100x100&s=100x100&t=picttext "[商品価格に関しましては、リンクが作成された時点と現時点で情報が変更されている場合がございます。]")
![[商品価格に関しましては、リンクが作成された時点と現時点で情報が変更されている場合がございます。]](https://hbb.afl.rakuten.co.jp/hgb/38943afe.b4232a1b.38943aff.3dfb7d7d/?me_id=1278318&item_id=10000451&pc=https%3A%2F%2Fthumbnail.image.rakuten.co.jp%2F%400_mall%2Firobotstore%2Fcabinet%2Fitem_thum%2Fbr_thum%2Fj9p_tm.jpg%3F_ex%3D100x100&s=100x100&t=picttext "[商品価格に関しましては、リンクが作成された時点と現時点で情報が変更されている場合がございます。]")