numpy の loadtxt で読み込む行を省略したい場合
スキップしたい行を # 等の記号でコメントアウトして、
loadtxt の comments = ‘#’ とすると省略できる。
例
import numpy as np
from matplotlib import pyplot as plt
data_set = np.loadtxt(fname='data.csv',dtype='float',delimiter=',', comments='#')
fig, ax = plt.subplots()
size = 300
for data in data_set:
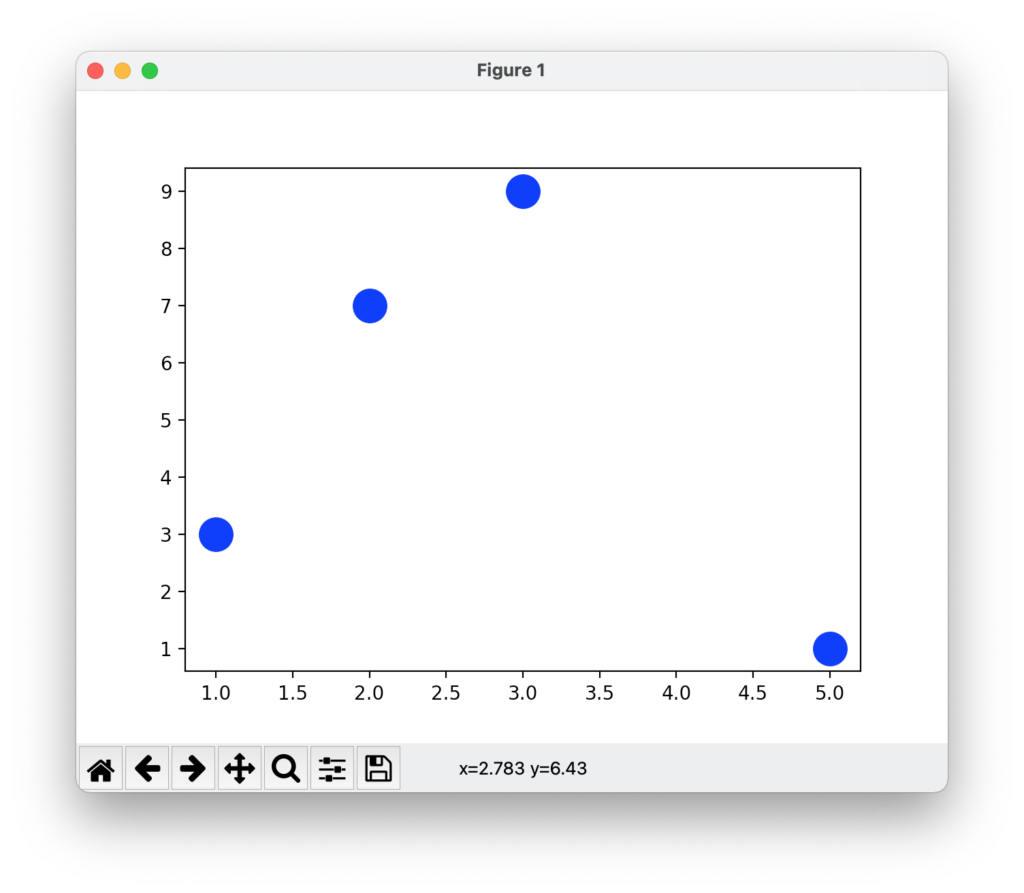
ax.scatter(data[0],data[1],size,'blue')
plt.show()data.csv
# first second
1,3
2,7
3,9
# 4,7
5,1
結果

![[商品価格に関しましては、リンクが作成された時点と現時点で情報が変更されている場合がございます。]](https://hbb.afl.rakuten.co.jp/hgb/2ae66f5e.1c6eabdc.2ae66f5f.baa0ec1d/?me_id=1339082&item_id=10089082&pc=https%3A%2F%2Fthumbnail.image.rakuten.co.jp%2F%400_mall%2Fitunes%2Fcabinet%2Fmem_item%2Fimgrc0090874582.jpg%3F_ex%3D240x240&s=240x240&t=picttext "[商品価格に関しましては、リンクが作成された時点と現時点で情報が変更されている場合がございます。]")

![[商品価格に関しましては、リンクが作成された時点と現時点で情報が変更されている場合がございます。]](https://hbb.afl.rakuten.co.jp/hgb/38943163.9ed7feb6.38943164.feb189f1/?me_id=1370968&item_id=10199606&pc=https%3A%2F%2Fthumbnail.image.rakuten.co.jp%2F%400_mall%2Fgpgiftcard%2Fcabinet%2Fnewcrad.jpg%3F_ex%3D240x240&s=240x240&t=picttext "[商品価格に関しましては、リンクが作成された時点と現時点で情報が変更されている場合がございます。]")
![[商品価格に関しましては、リンクが作成された時点と現時点で情報が変更されている場合がございます。]](https://hbb.afl.rakuten.co.jp/hgb/1e4f62be.725c8a0a.1e4f62bf.82312a17/?me_id=1269553&item_id=13798775&pc=https%3A%2F%2Fthumbnail.image.rakuten.co.jp%2F%400_mall%2Fbiccamera%2Fcabinet%2Fproduct%2F7134%2F00000010267425_a01.jpg%3F_ex%3D100x100&s=100x100&t=picttext "[商品価格に関しましては、リンクが作成された時点と現時点で情報が変更されている場合がございます。]")
![[商品価格に関しましては、リンクが作成された時点と現時点で情報が変更されている場合がございます。]](https://hbb.afl.rakuten.co.jp/hgb/1e4f62be.725c8a0a.1e4f62bf.82312a17/?me_id=1269553&item_id=12697495&pc=https%3A%2F%2Fthumbnail.image.rakuten.co.jp%2F%400_mall%2Fbiccamera%2Fcabinet%2Fproduct%2F4694%2F00000007127888_a01.jpg%3F_ex%3D100x100&s=100x100&t=picttext "[商品価格に関しましては、リンクが作成された時点と現時点で情報が変更されている場合がございます。]")
![[商品価格に関しましては、リンクが作成された時点と現時点で情報が変更されている場合がございます。]](https://hbb.afl.rakuten.co.jp/hgb/2124eef8.f98c36bb.2124eef9.b64e560c/?me_id=1357621&item_id=10581058&pc=https%3A%2F%2Fthumbnail.image.rakuten.co.jp%2F%400_mall%2Fyamada-denki%2Fcabinet%2Fa07000292%2F6892433018.jpg%3F_ex%3D100x100&s=100x100&t=picttext "[商品価格に関しましては、リンクが作成された時点と現時点で情報が変更されている場合がございます。]")
![[商品価格に関しましては、リンクが作成された時点と現時点で情報が変更されている場合がございます。]](https://hbb.afl.rakuten.co.jp/hgb/38943afe.b4232a1b.38943aff.3dfb7d7d/?me_id=1278318&item_id=10000451&pc=https%3A%2F%2Fthumbnail.image.rakuten.co.jp%2F%400_mall%2Firobotstore%2Fcabinet%2Fitem_thum%2Fbr_thum%2Fj9p_tm.jpg%3F_ex%3D100x100&s=100x100&t=picttext "[商品価格に関しましては、リンクが作成された時点と現時点で情報が変更されている場合がございます。]")
